When completing academic work, there may be times when you have data objects (images, charts, graphs, etc.) in another program that you need to include in your document. You may have the option to link or embed these objects. If you choose to embed the object, it will be pasted in your document similar to how an image or photo would be pasted. However, linking the object will create a link between your source data and your report. In this case, if the source data is changed, the object in your report will be updated. There are pros and cons for both embedding and linking. We will examine some of these in the next sections.
Acquiring the practice document
If you are beginning this course at this point, you will need to access the practice document.
Downloading the practice document for Microsoft Word
If working in Microsoft Word, you will download and extract the document.
- To begin downloading the practice document, click the following button:
For detailed instructions on downloading and extracting files in Google Chrome or Firefox, visit Getting Started with Exercise Files.
Copying the practice document in Google Docs
In Google Docs, you will copy the practice document to your Google Drive.
- To begin copying the practice document in a new browser window,
Right-click Copy practice document, Click Open link in new window
The file begins to open in a new window of the web browser. Before the document will open and can be edited, we need to make a copy of it.
Move to the new browser window.
- To copy the document file, in the browser window,
Click ![]()
A copy of the file is now open and, by default, is saved in your Google Drive. The filename now has the words "Copy of" at the beginning.
Acquiring the practice spreadsheet
For the next section, you will need to download a practice spreadsheet.
Downloading the practice spreadsheet for Microsoft Word
If working in Microsoft Word, you will download and extract the spreadsheet.
- To begin downloading the practice spreadsheet, click the following button:
For detailed instructions on downloading and extracting files in Google Chrome or Firefox, visit Getting Started with Exercise Files.
Copying the practice spreadsheet in Google Docs
In Google Docs, you will copy the practice spreadsheet to your Google Drive.
- To begin copying the practice workbook in a new browser window,
Right-click Copy practice workbook, Click Open link in new window
The file begins to open in a new window of the web browser. Before the document will open and can be edited, we need to make a copy of it.
Move to the new browser window.
- To copy the workbook file, in the browser window,
Click ![]()
A copy of the file is now open and, by default, is saved in your Google Drive. The filename now has the words "Copy of" at the beginning.
Considering inclusive design
When working with any type of visual element, including charts and graphics, it is important to consider our audience and how they will view our document. Is this graphic necessary to understanding the content? If a reader can't see the graphic because of a visual impairment or a slow internet connection, it is important that they can still understand the content of the document. There are steps we can take to ensure inclusive access.
Linking to a chart
The spreadsheet we are using contains the average high and low temperatures for Indiana. A line chart has been created to give a visual representation of these temperatures. We want to link this chart to our document.
Linking an object provides a couple of large benefits: If the source data is updated or edited, those changes will appear in the document. The object won't have to be inserted again. In addition, linking means the source data is saved in its original location, not in your document. This can reduce the size of your document.
It is important to note that if you link to an object, the source data can not be moved or deleted. It will have to stay in the same place or the link will need to be recreated.
As is often the case, there are several ways objects can be linked. We will copy and paste the chart to link it to the document.
- Open the spreadsheet file, if necessary.
- In Microsoft Word, to enable editing, if necessary,
Click

- To select the chart, in the spreadsheet file,
Click the chart
- To copy the chart, in the spreadsheet file,
In Microsoft Excel, on the Home tab, in the Clipboard group, Click

In Google Sheets, on the Menu bar, Click Edit, Click Copy
- Return to the document.
- To add space for the chart at the end of the "Wildflowers by season" section,
Click at the end of the last sentence in the section, press: Enter key
- To open the Paste Special dialog box, on the Home tab, in the Clipboard group,
Click
 , Click Paste Special...
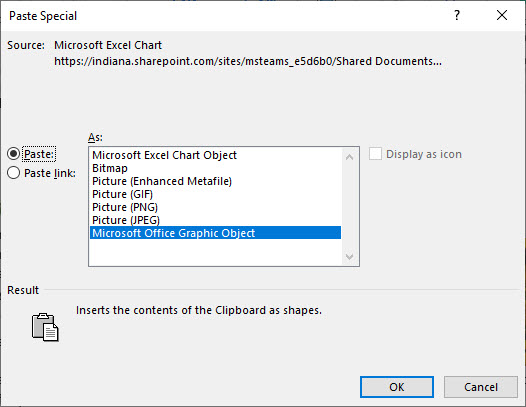
The Paste Special dialog box opens:
In this dialog box, we can choose if we want to paste the object or paste a link to the object. We want to paste a link.
- To paste a link, in the Paste Special dialog box,
Click the Paste link radio button, Click

- Return to the document.
- To add space for the chart at the end of the "Wildflowers by season" section,
Click at the end of the last sentence in the section, Press: Enter key
- To paste a link to the chart, on the keyboard, press:
Control key + V
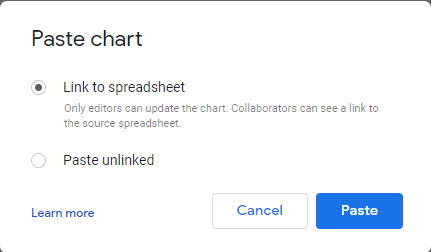
The Paste chart dialog box opens:

In this dialog box, we can choose if we want to paste a link to the spreadsheet or if we want to paste the chart unlinked. We want to paste a link, therefore we can accept the default settings.
- To accept the default and paste the link, in the Paste chart dialog box,
Click

The chart is now visible in the document. It may need to be resized. Additionally, it would look nice if the chart was centered.
- Select the chart, if necessary.
- To resize the chart, if necessary,
Press & drag the lower right sizing handle up and to the left
- To center the chart,
In Microsoft Word, on the Home tab, in the Paragraph group, Click

In Google Docs, on the toolbar, Click

Modifying the source data
Now that we've pasted the chart as a link, let's see how that link works. We'll return to the spreadsheet file, make a change, and update the document to reflect that change.
Currently, the chart shows the low temperature in July as 36 degrees. Not only does this not go along the curve of low temperatures, but it also doesn't make logical sense that the low temperature in July would be 36 degrees. There has been a data entry error. The correct low temperature is 66 degrees. Let's change that value in the spreadsheet and see what happens to the chart in our document.
- Return to the spreadsheet file.
- To change the low temperature for July,
Click in cell C8, type: 66 Enter key
The chart automatically updates in the spreadsheet. Let's return to the document and see what has happened. Depending on the timing and the speed of your internet connection, the chart may already be updated in the document. If the chart still shows incorrect data, we can force the document to check for new data and update the chart.
- Return to the document.
- Select the chart.
- To update the data,
In Microsoft Word, on the Chart Design tab, in the Data group, Click

In Google Docs, to update the data, in the chart, Click

NOTE: If the Update button is not visible in Google Docs, on the menu bar, Click Tools, Click Linked Objects. In the Linked objects panel, Click ![]() .
.
Adding alternative text
Now that the chart is in the correct place and contains the correct data, let's make sure that all of our readers can gain information from it. We will add alternative text. Alt text is used by screen reading software to describe a graphic to a user who can't see it.
- Select the chart, if necessary.
- To open Alt Text options,
In Microsoft Word, Right-click in a blank area of the chart, Click Edit Alt Text...
In Google Docs, Right-click the chart, Click Alt Text
In Microsoft Word, the Alt Text pane opens. In Google Docs, the Alt Text dialog box opens. Both have a place for us to add a description. Google also includes an area for a title.
- To add a title in Google Docs,
Click in the Title field, type: Average Temperatures line chart
- To add a description,
Click in the Description field, type: Line chart showing the average temperatures for Indiana. The warmest months are June, July, and August. The coldest months are January, February, and December.
- To close the Alt Text options,
In Microsoft Word, Click

In Google Docs, Click

Removing the link
There may be occasions when you don't want the chart to be linked from the spreadsheet. In these cases, the link can be removed. The chart will remain in the document, but won't be updated.
The processes for removing the link vary greatly between Microsoft Word, Microsoft Word for Mac, and Google Docs. The steps have been separated below.
- To move to the Backstage area, on the Ribbon,
Click the File tab
- To see the document info, on the left side of the Backstage area,
Click Info
- To open the Links dialog box, in the lower-right corner of the screen,
Click

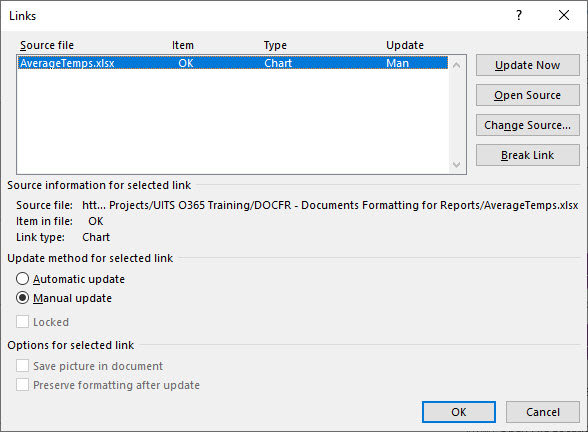
The Links dialog box opens:

The Links dialog box gives us several options for working with linked files. We can choose between automatically or manually updating the link. We can update the link, open the source file, and change the source file. The option we will use today is the choice to break the link.
- To break the link between the chart and the source data, in the Links dialog box,
Click

- To confirm that you want to break the link,
Click

The link has been broken.
- To close the Links dialog box,
Click

- To return to the document, in the upper-left corner of the Backstage area,
Click

- To save the document, on the keyboard, press:
Control key + S
- To open the Links dialog box, on the menu bar,
Click Edit, Click Links...
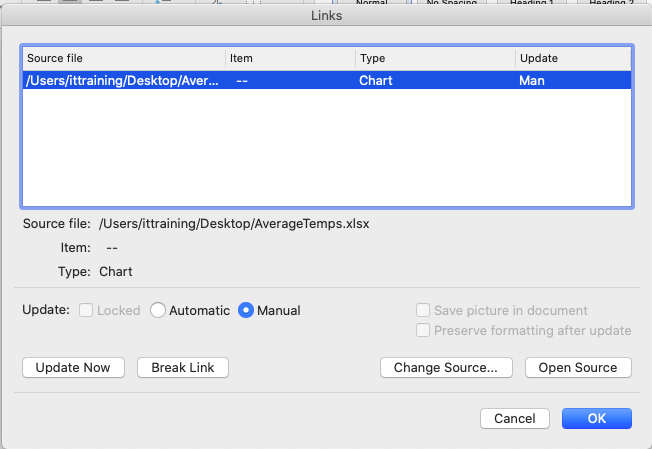
The Links dialog box opens:

The Links dialog box gives us several options for working with linked files. We can choose between automatically or manually updating the link. We can update the link, open the source file, and change the source file. The option we will use today is the choice to break the link.
- To break the link between the chart and the source data, in the Links dialog box,
Click

- To confirm that you want to break the link,
Click

- To close the Links dialog box,
Click

- To deselect the chart,
Click in a blank area of the document
- Save the document.
- Select the chart, if necessary.
- To open the linked chart options,
Click

- To unlink the chart,
Click

- To deselect the chart,
Click in a blank area of the document
The link has been removed and the chart will no longer be updated.

