No matter if your data is simple or complicated, pivot tables can be used to analyze the information and help make decisions. A pivot table is a dynamic table that summarizes, organizes, and compares data. Rows and columns may be rotated in a pivot table to allow different views of the data. The ability to "pivot" the dimensions of the table, for example, to transpose column headings to row positions, gives the pivot table its name.
Pivot tables help to answer questions about the data. For example, these are some questions that a pivot table might answer:
- How many students took BIOL1100 and averaged higher than a C?
- How much did each department pay in benefits?
- How many people aged 60-65 bought tickets to an event?
- What was the total profit from sales of PL2165 in the East region during the second quarter of the fiscal year?
- What was the average number of calls to a help desk by day, month, and year?
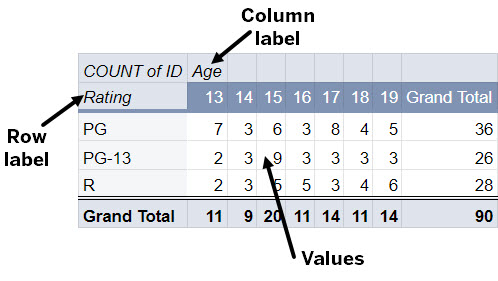
This is an example of a simple pivot table in Google Sheets:

This pivot table shows the number of tickets sold by movie rating (PG, PG-13, and R) and the age of the purchaser (13 years - 19 years). The Rating field is the row label and the Age field is the column label. The number of tickets sold by age and rating appears at the intersection of the fields.
The rows and columns can be pivoted, or rotated, to allow for different views of the same data. This is a safe way to manipulate data as the data itself remains unchanged. Only the view is altered.
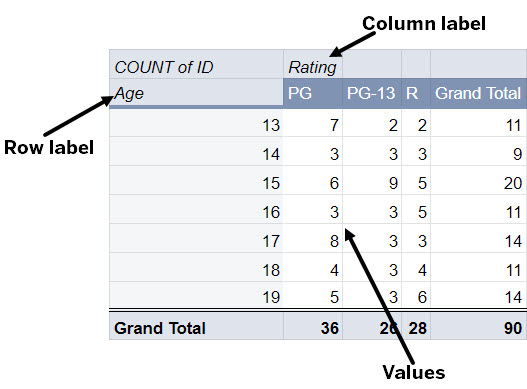
Now let's look at the same data after it has been pivoted.

In this pivot table, the Age field is now the row label and the Rating field is the column label. The number of tickets sold remains at the intersection of the fields.
Organizing the source data
Before creating a pivot table, the data needs to be well organized and clear. Putting forth a little extra effort up front will save time and frustration as you begin to build pivot tables and analyze the data. It is important that the following guidelines are followed:
- Columns should have unique and clear headings.
- All related data should be in the same column. For example, all last names should be in the Last Name column.
- Data within a column should be consistent. For example, use IN for Indiana, not Ind.
- Separate data into multiple columns. For example, instead of a column labeled Address that contains a full address, separate the data into Street, City, State, and Zip Code.
- Each row should contain a single record.
- Each row should have a unique identifier. This identifier will help differentiate duplicate data. Sometimes this will be obvious: a student ID number or an account number. If there isn't an obvious choice, simply number the rows.
- Do not include blank rows or columns within the data. Blank cells are permissible.
This is an example of poorly organized source data:

There are two students named Alex Smith however, they have different addresses and phone numbers. Because the data dow does not contain a unique identifier for each row we don't know if Alex Smith moved to a new address or if there are two students with the same name. The address column contains the full address (street address, city, and state). Because of this, we can not create a pivot table that shows students by state. The Class/Grade column combines class and grade information. It should also be separated into multiple columns.
This is an example of well-organized source data:

In the above example, each student has a unique identifier (ID Number). And it is clear that there are two students named Alex Smith. The address has been separated into multiple fields as have the department, class, and grade fields. Because of this, we can build a pivot table that shows students from specific states who took specific classes.


