Diagrams can make a complex concept easier to understand by providing a way to visualize the information. In Google Slides, diagrams are a collection of shapes and text boxes organized in a way that makes it easy to present. We have learned ways to edit text and shapes in previous lessons so we will be putting those skills to use when editing diagrams.
Copying the practice presentation
If you are beginning this course at this point, you will need to copy the presentation to your Google Drive.
NOTE: If you have been working through the course, your file should be up to date and you will not need to copy the practice presentation. You can move ahead to Adding a diagram.
- To begin copying the practice presentation in a new browser window,
Right-click Copy practice presentation, Click Open link in new window
The file begins to open in a new window of the web browser. Before the presentation will open and can be edited, we need to make a copy of it.
Move to the new browser window.
- To copy the presentation file, in the browser window,
Click ![]()
A copy of the file is now open and, by default, is saved in your Google Drive. The filename now has the words "Copy of" at the beginning.
Adding a diagram
Let's add a diagram to the slide titled "Timeline Diagram - Presentation Stages."
- To select the correct slide, in the Slide panel,
Click the slide titled "Timeline Diagram - Presentation Stages"
- To open the Diagrams panel, in the menu bar,
Click Insert, Click Diagram
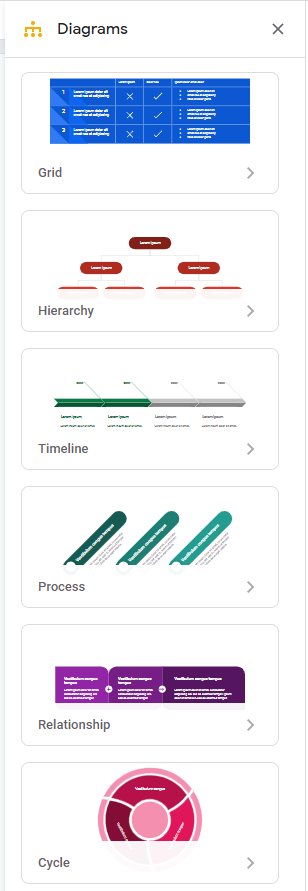
The Diagrams panel opens:

Using this panel, we can select which type of diagram we want to use. For today's purposes, we're going to use the Process diagram.
- To select the Process diagram, in the Diagrams panel,
Click the Process diagram
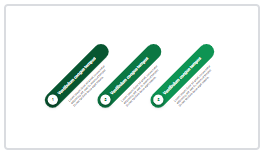
The Diagrams panel changes. We now see options for our Process diagram. Using this panel, we can adjust how many parts are in our diagram as well as the color. Three parts works well and doesn't not need to be changed. However, let's change the color.
- To see the color options, in the panel,
Click

- To change the color,
Click a recommended color
Green is used in these materials.
Now that everything is set the way we want it, we can insert the diagram into the slide.
- To insert the diagram, in the Diagrams panel,
Click

The diagram appears on the slide. Currently there is some placeholder text in the diagram. Let's replace this with meaningful text. To do this, we will need to select and delete the current text.
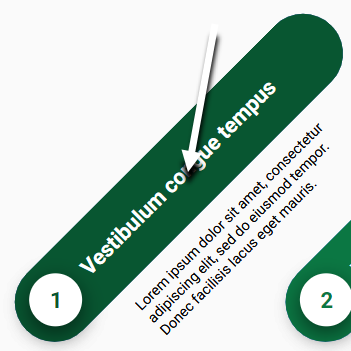
- To select the text in the first title part of the diagram,
Triple-click

- To delete the text, on the keyboard, press:
Delete key
- To add new text, type:
Prepare
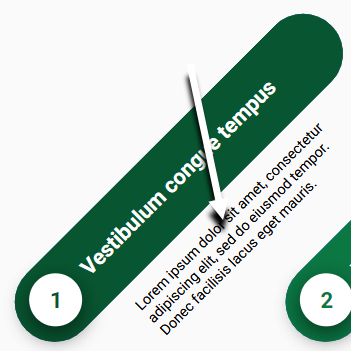
- To select the subtitle text under the first part of the diagram,
Triple-click

- To delete the text, on the keyboard, press:
Delete key
- To add new subtitle text, type:
Create the slides for your presentation
The diagram is looking more put together, however the font is too small for a presentation.
- To select the title text in the first part of the diagram,
Triple-click "Prepare"
- To change the font size, on the toolbar,
Click
 , Click 24
 - To select the subtitle text,
Triple-click the subtitle text
- To change the font size, on the toolbar,
Click
 , Click 12
Now that we have seen how to add text to the beginning of the diagram, we can easily add text to the remaining areas.
- Add the remaining text as follows:
Part Title Subtitle Font Size Part 2 Practice Read over the slides and time yourself 24 Part 3 Present Give the presentation to the audience 12
At this point, the diagram is complete.

