Reports allow you to create nice, printable summaries of your data that are easy to understand. Printed reports are essentially snapshots of the data at a particular moment in time, since updates to the data after the report is printed (or saved to PDF) will not change the printout.
Reports can be created based on existing tables or queries. The report we would like to create will show a list of departments and the faculty in those departments. We can base our report on qryAllFacultyByDept. This query already has all of the information that we'd like to appear in our report.
Creating a Simple Report
We'll start by using the Report button to see if that will meet our needs.
Step1. To select a query to form the basis of our report, in the navigation pane,
Click qryAllFacultyByDept
NOTE: As with Forms, you do not have to have the database object open, just selected in the navigation pane.
Step2. Click the Create tab on the Ribbon.
The Reports group of the Create tab, much like the Forms group, has several options. We're going to choose the simplest option to start, and see if it meets our needs.
Step3. To create a simple report, in the Reports group,
Click
Access takes the information found in the selected query, and creates a basic report. However, the results are not exactly what we're looking for. Access has created a simple listing, but it's not sorted in order by department like the query was. In addition, the content was wider than one page.
In general, the Report button works best when the object it's based on is not relational in structure. Instead of trying to modify the current report to meet our needs, we're going to close this report without saving, and try something else.
Step4. To close the report,
Right-Click the qryAllFacultyByDept tab, Click Close
Access asks if we would like to save our report.
Step5. To finish closing without saving,
Click
Since we were not satisfied with the results of the Report button, we'll try using the Report Wizard instead.
Creating a Report with the Report Wizard
This time we'll use the Report Wizard, which will walk us through some steps to allow us a little more control for how our report will look when finished.
Step1. Confirm that qryAllFacultyByDept is still selected in the navigation pane.
Step2. Return to the Create tab, if necessary.
Step3. To open the Report Wizard, in the Reports group,
Click
The Report Wizard opens:
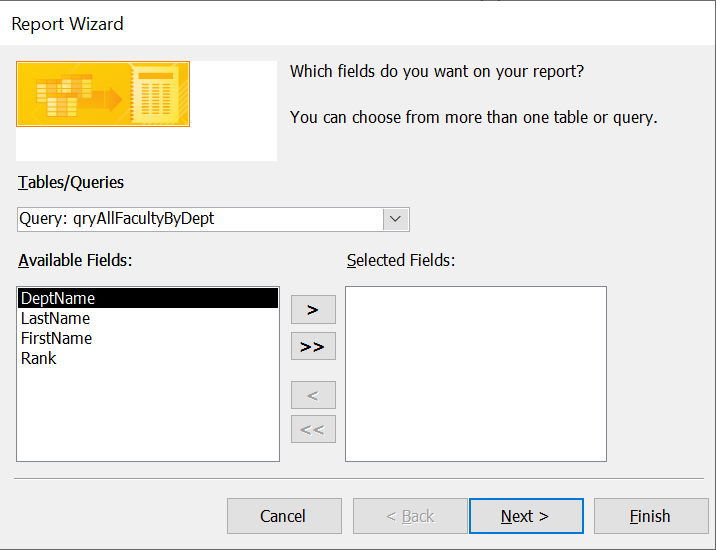
In the first screen, we can choose what fields to include in our report. Note that the Available Fields list contains all of the fields in qryAllFacultyByDept; this is because we had that query selected before we started the wizard.
This query has all of the fields we want for our report, so we will select them all at once by using the double chevron button.
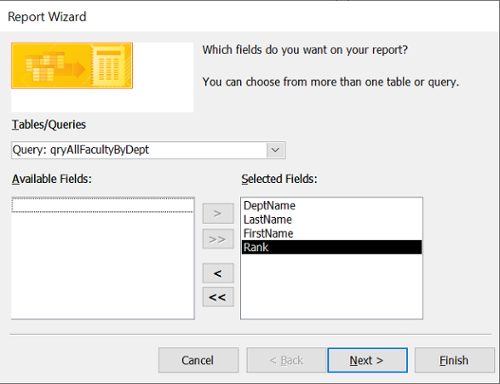
Step4. To move all fields from the Available Fields list to the Selected Fields list,
Click
Our screen should look like this:
5. To continue,
Click
The Report Wizard is able to recognize the underlying relationship between the two tables used for this report. As a result, it suggests a grouping order that exactly meets our needs:
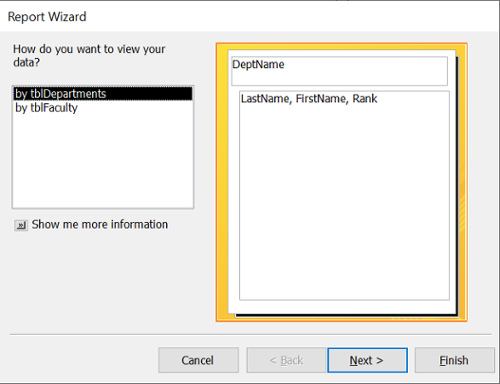
The report will be organized by department first, and then list all of the faculty for that department next. The other option, "by tblFaculty," would create a simple list of faculty with the department as the first field, but we'd prefer to have a listing grouped by department instead.
Step6. To continue,
Click
The next stage in the wizard allows us to add more groupings. For a complicated dataset, this can provide a very helpful way to organize our data. For example, we could choose to group our faculty by rank, so that all assistant professors in each department were listed before the associate and then full professors. For this report, we'll leave this extra grouping out.
Step7. To continue,
Click
The next option in the wizard allows us to consider ways to sort the detailed records:
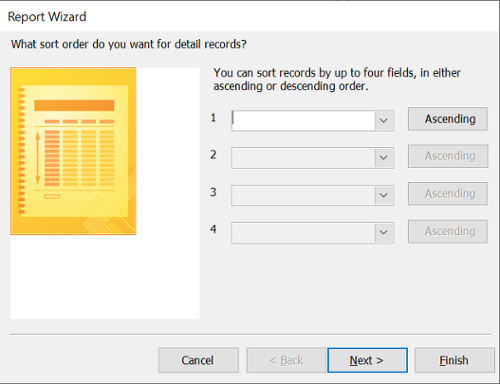
We can choose up to four levels of sorting at this stage. We would like to list the faculty of each department in alphabetical order by name.
Step8. To sort alphabetically by last name, on the first drop-down,
Click , Click LastName
Step9. To sort additionally by first name, on the second drop-down,
Click , Click FirstName
Now the faculty members will be listed alphabetically by first and last names within each of the department listings.
Step10. To continue,
Click
In the next screen of the wizard, we can choose from several layout options:
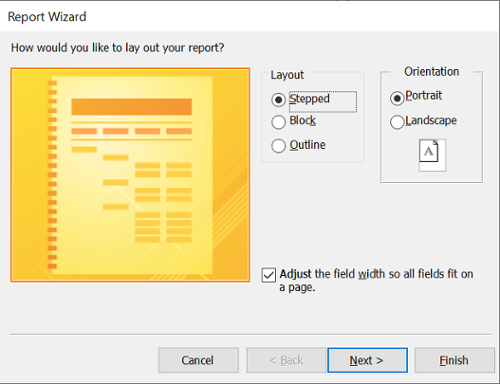
These options provide some flexibility in how the report can be staggered. The differences are fairly subtle. One option that we will take advantage of is the page orientation.
Step11. To choose the landscape orientation, in the right half of the dialog box,
Click the Landscape radio button
This will give us additional width to the page, which will make it easier to fit all of the fields across one page.
NOTE: There is an option on this screen to adjust the field widths so that they'll fit on a page, but the results are not always ideal, as sometimes fields are shrunk so small as to be illegible. In this case, we'll leave it selected, as it will not adversely affect our results.
Step12. To continue,
Click
Access now asks us to name our report. We'll start our file name with the Access convention for reports, "rpt."
Step13. To name our new report, in the top field,
Press & Drag across "tblDepartments," type: rptDepartmentsWithFaculty
In the bottom half of the dialog box, we could choose to further modify the report's design, but instead, we'll accept the default setting and preview our report.
Step14. To close the Report Wizard,
Click
Our report opens in print preview mode.
Step15. To view the report,
scroll down as necessary, Click to move to other pages
We see each department, and we have the faculty listed in alphabetical order, with a column for rank as well. As we navigate through the report we see new sections with each change in department.
There are many things we could adjust in our report to improve it, such as giving the report a better title, making the column headings larger, or adjusting the space that appears between faculty last names and first names, but we'll leave our report as is for now. To learn more about creating and formatting reports, consider taking Access: Designing the Database Interface.
We've finished our work in Access, so let's close it now.
Step16. To close Access, in the far upper-right corner,
Click