

As we saw in Access: The Basics, reports allow you to create nice, printable summaries of your data that are easy to understand. Printed reports are essentially snapshots of the data at a particular moment in time, since updates to the data after the report is printed, or saved to PDF, will not change the printout.
There are five tools for creating reports in Access:
- Report creates a quick report based on the tables or query selected in the Navigation panel.
- Report Design creates a blank report which opens in Layout View.
- Blank Report creates a blank report which opens in Design View.
- Report Wizard opens a wizard to help create a report. Fields from multiple tables and queries can be added to the report.
- Labels opens a wizard to help create labels. The report or query selected in the Navigation pane serves as the data for the labels.
In this workshop we will create reports using the Report tool and the Report Wizard. It is most often easier to use one of these methods and make edits to what Access produces than it is to create a report from scratch, so we won't cover creating using either the Report Design or Blank Report report tool. We also won't work with Labels today.
As when creating a form, it is useful to consider several questions first, to make sure that it is meaningful, usable, and user-friendly:
- How will the report be used?
- What information should be placed on the report?
- Where does the information belong on the report?
- How will information be displayed on the report?
- How does the report fit in with the rest of the database?
Creating a Report Using the Report Tool
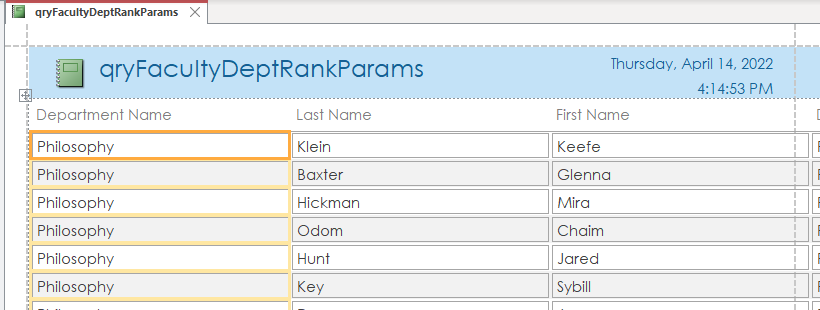
We would like to create a report that lists the faculty in each department based on rank. Let's use the Report tool to create a report based on a query. The query we'll use allows us to enter parameters for both department and rank, so we can choose what departments or ranks we want to include.
We need to expand our list of queries in the Navigation Pane to find the one that we need.
Step1. To expand the list of queries, in the Navigation Pane,
Click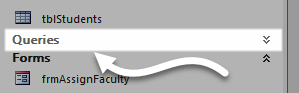
Step2. To select a query to base the report on,
Click qryFacultyDeptRankParams
NOTE: We do not need to open the query, just select it.
Step3. To create a report based on the selected query, on the Ribbon,
Click the Create tab, Click![]()
Step4. To enter a department, type:
p* Enter key
Step5. To include all ranks in our results, type:
* Enter key
Step6. To save the report, press:
Control key + S
Step7. To name the query, type:
rptFacultyDeptRankParams Enter key
Creating Reports Using the Report Wizard
We will create a transcript report to show our students' academic record at the university. The report design that we will create using the Report Wizard will look something like this:
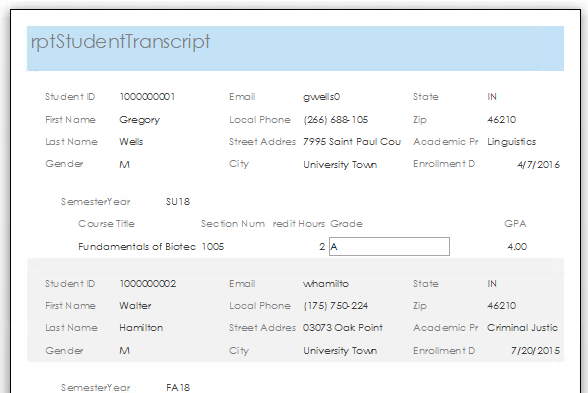
We will see how the Report Wizard can help us initiate a report, and then we will modify that report to fit our needs.
Using the Report Wizard
We will build our report by pulling information from several different tables, as well as a query. While we could create a new query with the information that we want, and base the report on it, that won't give us all of the options we'd like. Specifically, we want to be able to set up certain groupings, and they would not all be available if we started from a query.
Let's specify a beginning table for the Report Wizard.
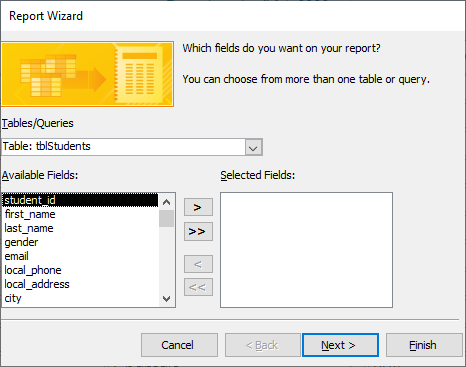
Step1. To select the main table for the report, in the Navigation pane,
Click tblStudents
Step2. To create a new report using the wizard, on the Ribbon,
Click the Create tab, Click![]()
NOTE: As seen in the previous screenshot, a display bug may cause part of the dialog box to be cut off. The Report Wizard dialog box may look slightly different on your screen than the one shown here as a result of this.
Step3. Confirm that the table listed in Tables/Queries is tblStudents.
Step4. To move all of the fields of the table onto the new form,
Click![]()
Placing Fields from Multiple Tables
Now that we have the student information we need, we can start selecting other information we want in the report.
Step1. To add data from another table, from the Tables/Queries drop-down list,
Click![]() , Click Table: tblSections
, Click Table: tblSections
Step2. To move the needed fields to Selected Fields,
Double-Click SemesterYear, SectionNumber
Step3. Use the table below to add the fields listed to the form:
| Table name | Fields |
|---|---|
| tblCourses | CourseTitle, CreditHours |
| tblEnrollments | Grade |
| qryGPACalc | GPA |
Step4. To continue,
Click![]()
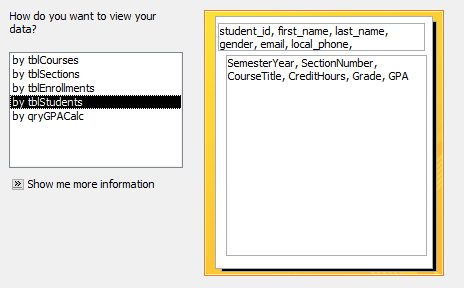
Selecting a View of the Data
We see that a grouping by tblStudents is the default view. This choice automatically groups a specific student's information first, and then shows detail information about the courses that the student took over his or her academic career. This is the view of the report we want. While we are on this step of the wizard, let's sample how the report arrangement would look if we were to choose to order the report by other objects.
Step1. To see how the report would look in Courses order,
Click by tblCourses
Step2. To see how the report would look in Section order,
Click by tblSections
Step3. To see how the report would look in Enrollment order,
Click by tblEnrollments
Step4. To see how the report would look in GPA order,
Click by qryGPACalc
Step5. To select the tblStudents order,
Click by tblStudents
Step6. To move to the next step of the wizard,
Click![]()
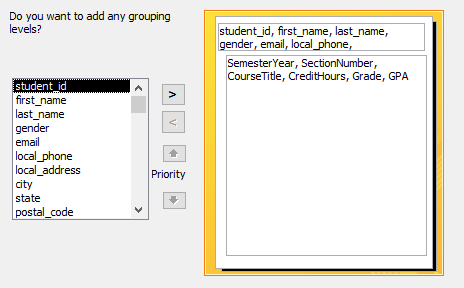
Setting Group Options
Since we have chosen to look at the records by students, this step of the wizard is asking if we want the course information for each section grouped in any additional way. It would make sense to group the courses taken in the same semester year together for the transcript.
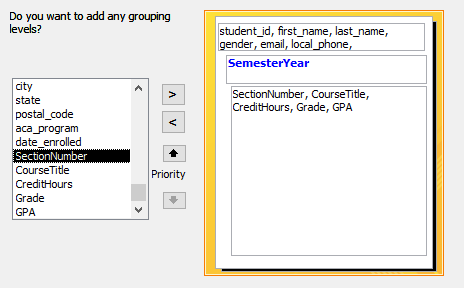
Let's add semester year as a grouping level.
Step1. To add a grouping level, in the list on the left,
scroll down, Double-Click SemesterYear
Step2. To move to the next step of the wizard,
Click![]()
Sorting Detail Records
This screen allows us to define the order that courses will appear in for each semester. For our report, we will choose to see the details sorted by the course title.
Step1. To add a sort order for course titles,
Click![]() , Click CourseTitle
, Click CourseTitle
Step2. To continue to the next step of the wizard,
Click![]()
Choosing a Report Layout
This step first allows us to choose the layout of the report. The following options are:
- Stepped layout puts all the labels for the fields in the page header, and lists them horizontally across the top of the page. This is a good choice for reports with a limited amount of fields.
- Block layout is similar to stepped layout, but depending on the number of grouping levels, not all labels for the fields will be in the page header. Each group level will have its own heading section with labels.
- Outline layout puts the labels and fields for each group in their own section and lists them in columns. This is a good choice if the report has many fields.
- Justified layout lists each label and field down the vertical length of the page. If a report has no grouping levels, the Outline layout is replaced with this layout.
Since we have quite a few fields in our report, we will pick the Outline layout.
We can also use this step to decide whether we want portrait or landscape layout for the report. The "Adjust the field width so all fields fit on a page" checkbox makes slight adjustments for spacing.
We'll start by selecting the Outline layout, because we have a lot of fields in our report, and it does a nice job of organizing many fields. Then we'll adjust the page orientation to Portrait.
Step1. To choose the outline layout for this report, in the Layout section of the Report Wizard dialog box,
Click the Outline radio button
Step2. To select the portrait layout orientation, in the Orientation section of the window, if necessary,
Click the Portrait radio button
Step3. To move to the last step of the wizard,
Click![]()
Naming and Previewing the Report
This window provides the opportunity to name the report. By default, it suggests a name based on our top-level grouping choice in the second screen of the wizard.
We want to choose a more appropriate and descriptive name, but the name we give the report here will initially be used in multiple ways. It names the database object, so it should follow the naming convention we have been using with other database objects. It also will become the title of the report, so it should reflect the content of the report clearly and concisely. In addition, it becomes the name on the tab of the report window.
We will apply a name using the database object naming convention for now, and see how to change the other properties later.
Step1. To select the current report name,
Press & Drag the current report name
Step2. To name the report, in the title window, type:
rptStudentTranscript
Step3. Verify that the "Preview the report" radio button is selected.
Step4. To complete the Wizard,
Click![]()
Step5. To zoom in and out, with the magnifying glass cursor,
Click on the report
Step6. Use the scroll bars to view different areas of the report.
Step7. To move to the last page of the report, in the Navigation bar,
Click![]()