Now that the daily sales for the Entrance location have been compiled, we are ready to add them to the worksheet that contains the sales for the other three locations: Food court, Grandstand, and Pavilion.
Let's take a look at that worksheet.
The following files are available for download:
Now that the daily sales for the Entrance location have been compiled, we are ready to add them to the worksheet that contains the sales for the other three locations: Food court, Grandstand, and Pavilion.
Let's take a look at that worksheet.
Click the Sales by Location worksheet tab
The Sales by Location worksheet looks similar to the Sales - Entrance worksheet, but there are a few differences.
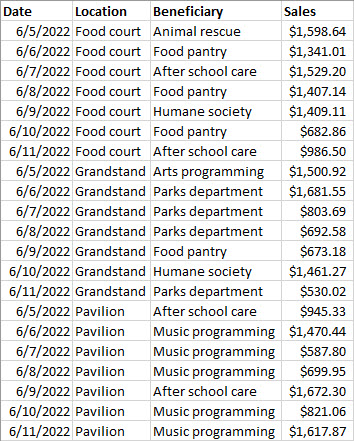
This worksheet contains sales data for three fundraising booths: Food court, Grandstand, and Pavilion. The worksheet shows the dates 6/5/2022 to 6/11/2022 and is in alphabetical order by location. The third column of the worksheet shows the beneficiaries for each booth and date. This is the group that will receive the donations from the booth. The fourth column shows the daily sales.
The Sales - Entrance worksheet does not contain a Beneficiary column. Let's move to that worksheet and add that data.
Click the Sales - Entrance worksheet tab
Before we can add this data to the Sales by Location worksheet, we need to add a column for the beneficiaries between the Location and Sales columns.
When a column is added to a worksheet, it is inserted to the left of the active cell.
Right-click the selected cell
Click Insert...
The Insert dialog box opens: 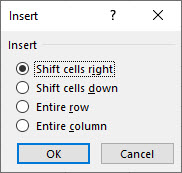
We have the option to shift cells up or to the right. We can also insert an entire row or column. We want to insert a column.
Click the Entire column radio button, Click ![]()
Beneficiary
The bold formatting is automatically applied to the new column header.
As we add the beneficiary information, you will notice that there is a lot of repetition. There are seven beneficiary groups and each group will receive donations from multiple fundraising booths on multiple days. Excel's AutoComplete feature makes data entry faster and more accurate by suggesting text that has already been entered in a column. After entering a word in a column once, Excel will prompt you to use that text again.
Let's add the first three beneficiaries and use the AutoComplete feature to add the remaining names.
Humane Society
Enter key
Senior Citizens Center Enter key
Arts Programming Enter key
The worksheet looks like this:
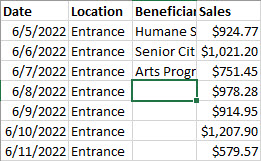
We are ready to add the remaining beneficiaries. These will all repeat the previously entered text. The AutoComplete feature will make this a quick and easy task.
We will widen the column after entering all of the data.
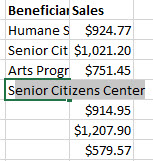
S
The AutoComplete feature fills in the remaining text: Senior Citizens Center.
Enter key
| Cell Reference | Value |
| C6 | Arts Programming |
| C7 | Senior Citizens Center |
| C8 | Arts Programming |
Double-Click between the column C and column D headers
The Sales - Entrance worksheet is complete and ready to be copied to the Sales by Location worksheet.
Before we add the sales from the entrance location to the Sales by Location worksheet, we will need to add rows for this data. The Sales by Location worksheet is in alphabetical order by location. Therefore, the sales for the entrance will go at the top of the list.
To add multiple rows (or columns), it is necessary to select as many rows as you wish to add. There are seven days of sales for the entrance location. We will add seven rows underneath the heading row (row 1) in the Sales by Location worksheet.
Let's move to the Sales by Location worksheet and add the rows.
Point to ![]()
Press & drag the headers for rows 2 through 8
The selected rows look like this:
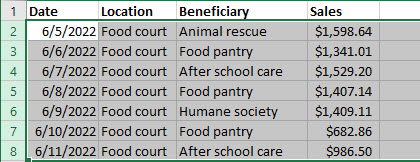
Right-Click the selected rows, Click Insert
With the new rows inserted, we have space to add the sales from the entrance location. We will do this by copying and pasting from the Sales - Entrance worksheet.
Once again, we will return to the Sales - Entrance worksheet. We will select and copy the data to paste into the Sales by Location worksheet.
Press & Drag A2:D8
Right-Click the selection, Click Copy
The selected data is now surrounded by a dashed border. This border is known as the marquee or marching ants. It gives us a way to know what data has been copied.
When pasting data in Excel, it isn't necessary to select the entire range of destination cells. We can choose the cell in the upper left corner of the blank range. The copied data will fill in the range from that cell.
It is important to paste data into empty cells. Any pasted data will overwrite the current contents of a cell.
In Microsoft Excel for Windows, Right-Click cell A2, Click 
In Microsoft Excel for macOS, Right-Click cell A2, Click Paste
Control key + S
The Sales by Location worksheet is now complete with seven days of sales for all four booth locations.