We have already seen how charts can be saved and reused as a template. Now we want to insert charts into another Microsoft Office application's document, specifically into one created in the PowerPoint application. We can paste a chart into a PowerPoint slide, embed a chart in a slide as an object, or link the slide to the Excel worksheet.
These methods are described below:
- You can simply copy selected charts in Excel and then use the Paste or Paste Special commands in PowerPoint to insert the charts into a presentation. The Paste Special command gives more flexibility in that it allows charts to be pasted in a variety of formats.
- An embedded object is an object that maintains a direct connection to its original program, known as the source program. An embedded object can easily be edited by double-clicking it, which gives you access to the appropriate commands on the Ribbon. Embedding an object in a presentation increases the file size since PowerPoint has to store the data as well as information about how to display the data.
- A linked object is just a representation on a slide of information that is still stored in the original document, known as the source document. When you edit the source document in the source program after adding a linked object to a slide, PowerPoint will update the representation of the object. PowerPoint stores only the data needed to display the information, and so linking results in a smaller file size than embedding.
In this workshop, we will explore using the Paste and the Paste Special commands to insert charts into PowerPoint slides.
Using the Paste Command
One method of bringing an Excel chart into a PowerPoint presentation is by using the regular Copy and Paste commands. The results of a copy and paste method can vary in Microsoft Office applications, depending on what is being pasted and which Microsoft applications are involved. For example, an Excel data range copied and pasted into Word is pasted as a static table. However, an copied Excel chart is pasted into PowerPoint as a link.
Let's launch PowerPoint, open the desired presentation file, and insert a chart into it by using the regular Copy and Paste command.
Step1. Launch PowerPoint.
Step2. To begin to open the file, in the left pane,
Click Open Other Presentations
NOTE for MacOS Users: To begin to open the file, on the menu bar, in the File menu, Click Open.
Step3. To browse for the file,
Click
NOTE for MacOS Users: To browse for the file, Click .
.
Step4. To open the desired file,
navigate into the ExcelCharts folder on your Desktop,
Double-Click Results.pptx
Step5. To access the second slide, press:
Page Down key
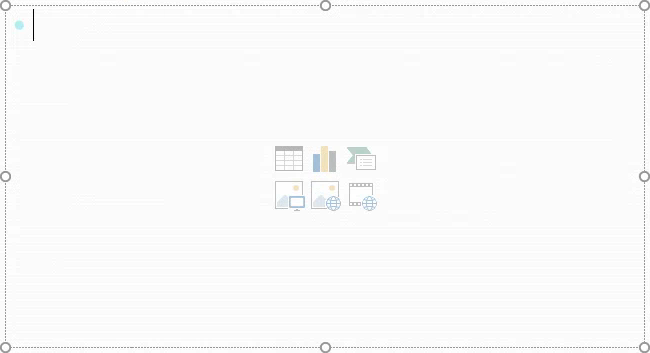
Step6. To select the slide placeholder,
Click any blank area within the placeholder

Step7. To switch back to Excel,
Click the Microsoft Excel file
Step8. Select the first bar chart in the Survey Data worksheet.
Step9. To copy the selected Excel chart, press:
Control key+c
NOTE for MacOS Users: To copy the selected Excel chart, press Command key+c.
Step10. To switch to the PowerPoint presentation,
Click the Microsoft PowerPoint file
Step11. To paste the copied chart, press:
Control key+v
NOTE for MacOS Users: To paste the copied chart, press Command key+v.
Step12. To view the Paste Options button, at the bottom right corner of the chart,
Click

- Use Destination Theme & Embed Workbook
- Keep Source Formatting & Embed Workbook
- Use Destination Theme & Link Data (the default)
- Keep Source Formatting & Link Data
- Picture
NOTE for MacOS Users: The wording of the options in the menu is slightly different.
Step13. To keep source formatting and embed the workbook,
Click Keep Source Formatting & Embed Workbook
NOTE for MacOS Users: To keep source formatting and embed the workbook, Click both the "Keep Source Formatting" and the "Excel Chart (entire workbook)" radio buttons.
Step14. Resize the chart, if necessary.
Step15. Deselect the chart.
Using the Paste Special Command
Now that we have seen how the regular copy and paste command works, we will explore some of the Paste Special commands. If we are certain that our chart is a final copy and that future changes will not be made to it, then pasting the chart as a picture using the Paste Special method is a good choice. The Paste Special command gives us more control and allows us to choose the most appropriate option.
Next we will paste a chart into a PowerPoint presentation using the Paste Special command.
Step1. To access the third slide, on the keyboard, press:
Page Down key
Step2. To select the slide placeholder,
Click any blank area within the placeholder
Step3. To switch to Excel,
Click the Microsoft Excel file
Step4. To select the Scatter Chart worksheet,
Click the Scatter Chart worksheet tab
Step5. To select the chart with the callout,
Click the chart area
Step6. To copy the selected Excel chart, press:
Control key+c
NOTE for MacOS Users: To copy the selected Excel chart, press Command key+c.
Now that we have copied the chart, we will move back to the PowerPoint file that has already been created.
Step7. To switch to the PowerPoint presentation,
Click the Microsoft PowerPoint file
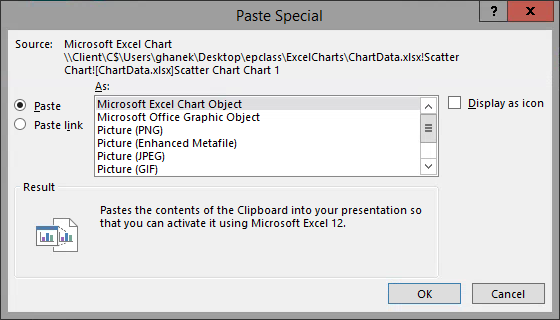
Step8. To paste the chart, in the Clipboard group,
Click , Click Paste Special...

- Microsoft Excel Chart Object - inserts the chart as an object floating on a layer, just as an embedded chart floats above the cells in a worksheet. Attempting to edit it will open Excel.
- Microsoft Office Graphic Object - inserts the chart as a graphic object that can be edited by using the chart tools on the Ribbon. This option is not available when using compatibility mode.
- Picture (PNG) - the chart is pasted as a PNG (Portable Network Graphics) image. The PNG format is similar to GIF, but it provides better color support. It compresses solid areas of color while preserving sharp details, such as detail in line art or logos. PNG format does not support animation.
- Picture (Enhanced Metafile) - the chart is pasted as a picture. Picture format generally provides better display than bitmap format. You can save a picture as a 32- bit graphic, which supports more sophisticated graphics functions.
- Picture (JPEG) - the chart is pasted as a JPEG image, which may result in a fuzzy image. The JPEG file format supports 16 million colors and is best suited for photographs and complex graphics.
- Picture (GIF) - the chart is pasted as a GIF image. GIF is a good format for line drawings, black and white images, small text that is only a few pixels high, and animation.
- Picture (Windows Metafile) - the chart is pasted as a picture. This format can be saved as a16-bit graphic for use with Windows 3.x and later.
- Device Independent Bitmap - the chart is pasted as a bitmap image, related to a device's output display resolution.
- Bitmap - the chart is pasted as a bitmap image. The BMP format can display millions of colors and is practical to use when providing an image for someone who does not have the program in which you created the image.
NOTE for MacOS Users: The Paste Special options in Powerpoint 2016 for Mac are Microsoft Excel Chart Object (can edit in Excel), Microsoft Office Graphic Object (can edit with Ribbon tools), PDF, and Picture (TIFF).
Step9. To begin to paste the chart as a picture,
Click Picture (Enhanced Metafile)
NOTE for MacOS Users: To begin to paste the chart as a picture, Click Picture (TIFF).
NOTE: The Picture (Windows Metafile) and Picture (Enhanced Metafile) both produce similar results. However, the Picture (Enhanced Metafile) allows for more graceful resizing of the picture once it is pasted into PowerPoint.
Step10. To finish pasting the chart,
Click
Step11. Resize the chart, if necessary.
Step12. Save the PowerPoint presentation.
Step13. Exit PowerPoint
Step14. Save the workbook ChartData.xlsx.
Step15. Exit Excel.

