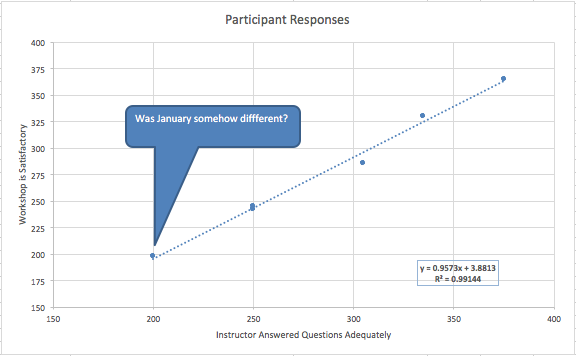
Several non-chart-related graphic tools are available in Excel, which can be used to enhance a chart or worksheet. Excel provides access to a variety of graphic images known as Shapes, which are organized into several categories. Many of the shapes can also include text in them, as do text boxes. Callouts are special text box shapes that can be used to call attention to or describe an important item. After drawing a callout, you can immediately begin typing the text you want in the callout.
First we will select the chart and then draw a shape to emphasize the survey responses for January, which are at the lowest end of our data trend. We are emphasizing this, to call attention to an area of potential improvement which has been identified by the University of the Midwest community members in the survey.
Step1. Select the chart, if necessary.
Step2. To switch to the Insert command tab, on the Ribbon,
Click the Insert tab
Step3. To view the shapes, in the Illustrations group,
Click
NOTE: It may be necessary to scroll to see all of the shapes.
Step4. To select a shape, in the Callouts category,
Click the rounded rectangular callout
Step5. To create the shape on the second chart,
Press & Drag the crosshair cursor above the lowest data point in the plot area
NOTE: You can press and hold the Shift key while dragging to maintain the object's default proportions.
Step6. To activate a text cursor in the text box, if necessary,
Right-Click the text box, Click Edit Text
NOTE for MacOS Users: To activate a text cursor in the text box, if necessary, press: Control key+Click in the shape, Click Edit Text.
Step7. To add the desired text to the callout, type:
Was January different somehow?
NOTE: If the text box is too large or not large enough to accommodate all of the text, you can resize the shape. You can also select and format text using the same commands you use for text in cells.
Step8. Resize and reposition the callout, if needed.
Step9. Verify that the callout is selected.
Step10. To position the tip of the callout indicator near the Disagree bar,
Press & Drag the yellow square handle towards January data point
Step11. Apply a different fill color, if desired, using the Format Shape task pane.
NOTE for MacOS Users: Fill color and other shape formatting options are located on the Shape Format command tab, on the Ribbon.
Step12. Deselect the callout.

13. Save the workbook ChartData.xlsx.
Applying Themes
Using document themes is an easy way to specify colors, fonts, and a variety of graphic effects in a document. Since themes are incorporated into other Microsoft Office applications, we can easily create a standard look for all documents. Theme effects affect graphic elements, such as SmartArt and shapes.
NOTE: It is important to remember that themes apply to an entire Excel workbook. It is not possible to use different themes in different worksheets within a workbook.
We will explore some various themes for our workbook.
Step1. Switch to the Page Layout tab.
NOTE for MacOS Users: The Themes button is in the Home tab, in the Themes group.
Step2. To view a theme, in the Themes group,
Click
Step3. To view a theme, in the Themes gallery,
Pointto any theme
Step4. To select a theme,
Clickany theme
NOTE: You can also change theme colors, fonts, and effects.
Step5. To view other charts,
Clickany completed worksheet tab
Step6. Save the workbook ChartData.xlsx.

