Next we want to show our students how easy it is to create a table in PowerPoint. Since presentations often include facts and figures, tables can be a useful way to display information.
Today we will create a table that displays the enrollment figures for the class of 2016 at our high school.
Inserting a Table
We will add a table to slide 7 now.
Step 1. To move to slide 7, in the slide thumbnail list,
Click on slide 7
Step 2. To move to the Insert tab, on the Ribbon, if necessary,
Click the Insert tab
Step 3. To begin creating a table, in the Tables group,
Click ![]()
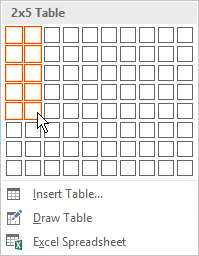
Step 4. To select the number of rows and columns for the table,
Press & Drag over the grid to select a 2 x 5 area

Step 5. To begin to reposition the table on the slide, if necessary,
Point to the frame around the table
Step 6. To position the table on the slide,
Press & Drag the table to the center of the slide
Step 7. To make the table larger,
Press & Drag the sizing handle towards the bottom of the slide
Adding Text to a Table
Now that our table has been created and resized, we are ready to add some data to it.
For the purpose of accessibility, it is important that our table has a header row and descriptive column headers.
Step 1. To confirm that our table has a header row, on the Table Tools Design tab, in the Table Styles Options group, if necessary,
Click the Header Row checkbox
Step 2. To enter a header in the first cell of row 1,
Click the first cell
Step 3. To enter text, type:
Class
Step 4. To move to the next header in row 1, press:
Tab key
Step 5. To enter text, type:
Number of Students
Step 6. To move to the second row, press:
Tab key
Step 7. To complete the table, type the following information so that your table looks like this:
| Class | Number of Students |
|---|---|
| First Year | 288 |
| Sophomores | 333 |
| Juniors | 279 |
| Seniors | 362 |
Adding Alternative Text for a Table
Before moving on, we must add alternative text. Since this is a simple table, this won't be a problem, but the use of complex tables can create accessibility challenges since they typically lack structural tags. Therefore, if we plan to post a presentation that contains large amounts of important data, we might want to consider using a list format in place of the complex table, and we should always use clear, detailed alternative text.
Because a screen reader will read the information in a table line by line, the data will often sound meaningless. It is extremely important that we include an accurate, detailed description.
Step 1. Verify that the table is still selected.
Step 2. To begin adding the alternative text, on the Quick Access Toolbar,
Click ![]()
NOTE for MacOS Users: To begin adding the alternative text, Control key+Click the shape, Click Format Shape..., Click  .
.
Step 3. To add a description, in the Description field, type:
A table comparing the number of students in each class. The senior class has the greatest number of students.
Step 4. To close the Format Shape pane,
Click 
Formatting a Table
We decide that our table would look better if it were a different color. We can change the look of our table by using the contextual tabs on the Ribbon.
Step 1. Verify that the table is still selected.
Step 2. To access the Table Styles gallery, on the Ribbon, under Table Tools, if necessary,
Click the Design tab
NOTE for MacOS Users: The tab is labeled Table Design.
Step 3. To change the table style,
Click 
Step 4. To select a new table style,
Click any table style
Step 5. To access the Layout tools, under Table Tools, on the Ribbon,
Click the Layout tab
Step 6. To select all of the text in the table,
Press & Drag across all text in the table
Step 7. To center the text horizontally, in the Alignment group,
Click 
Step 8. To center the text vertically, in the Alignment group,
Click 
Step 9. To deselect the table,
Click on the outer edge of the slide
Step 10. Save the presentation Creating_a_Presentation.pptx.

